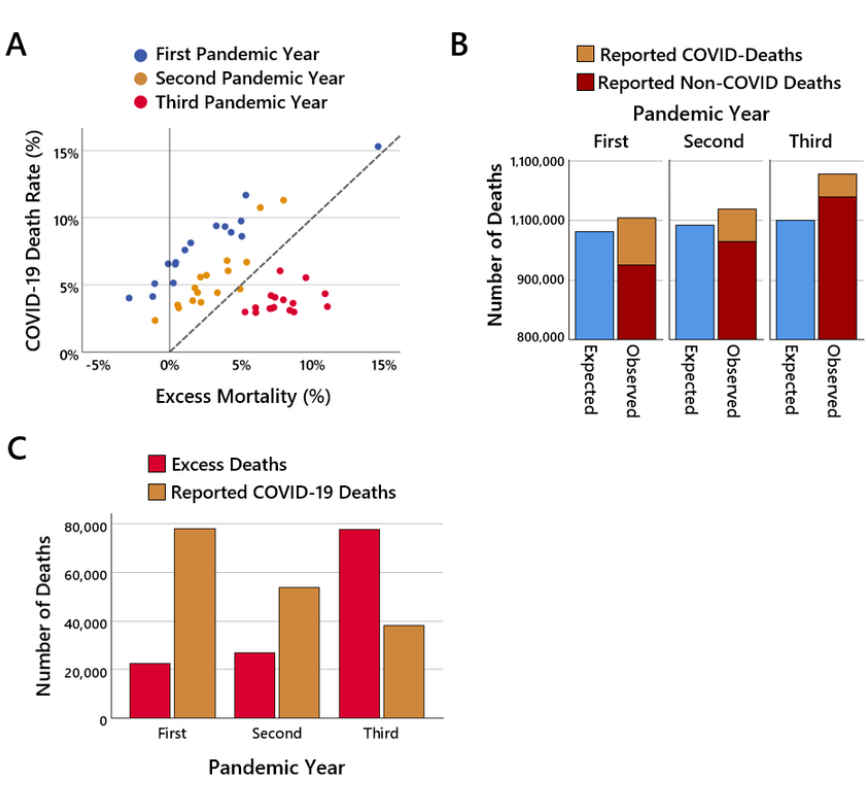
A recent study investigating the impact of COVID-19 on mortality across Germany’s sixteen federal states has highlighted significant variations in excess mortality throughout the ‘pandemic’ years.
By comparing observed all-cause deaths to statistically expected deaths using state-specific data, researchers aimed to quantify the pandemic’s burden on each federal state.
The study examined a range of factors, including pandemic-related measures, infection rates, vaccination rates, and socio-economic indicators, to understand their correlation with excess mortality.
Findings revealed that excess mortality was generally low in the first year of the pandemic but increased markedly in the second and third years, with substantial differences among states.
While early excess mortality correlated strongly with reported COVID-19 deaths, this pattern did not hold in the latter years, despite a decrease in COVID-19 fatalities.
Instead, a striking positive correlation emerged between excess mortality and vaccination rates in the second and third years, reaching a high correlation coefficient (r = 0.85) by the third year.
The disturbing result suggests that factors beyond COVID-19 exposure, likely related to COVID mRNA gene therapy (marketed to the public as a ‘vaccine’), may have influenced mortality trends. This warranted further investigation into potential adverse effects of COVID-19 vaccinations, said researchers. No other significant correlation patterns were identified, emphasising the need for continued research to fully understand the drivers behind the observed excess mortality.

Its gotten so glaringly obvious, no one is surprised anymore. Well, except the govt and its paid shills…..
…except the govt and its paid shills….well, these creatures are too cunning to be surprised.
But also maybe too arrogant to realize how corrupt they have become.